Monitoring model
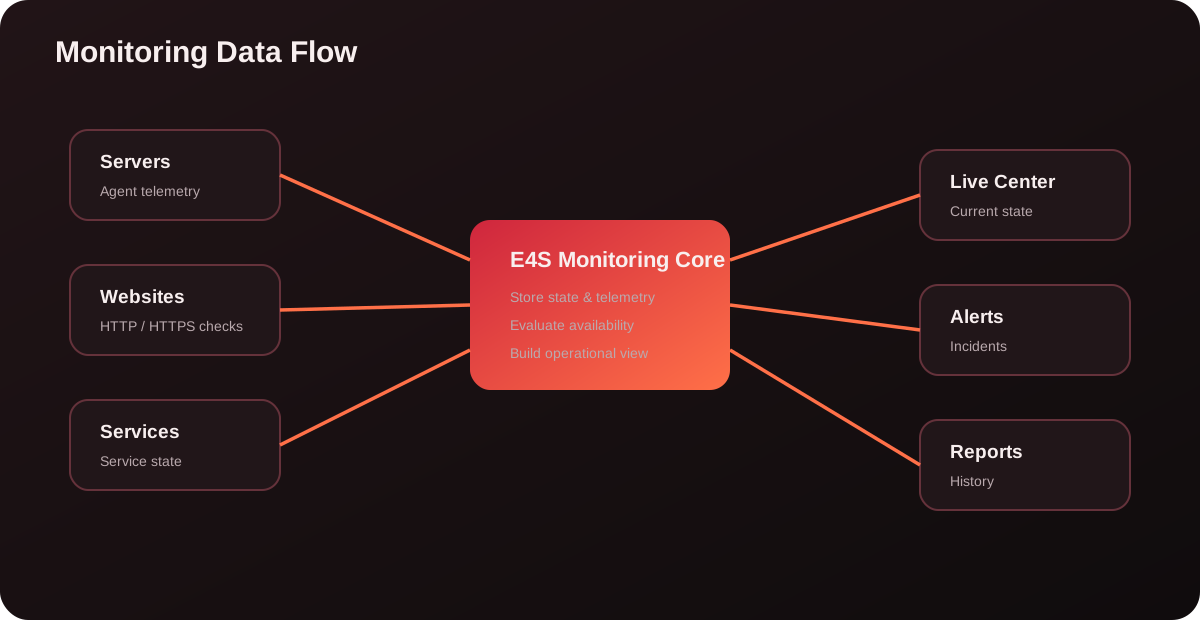
E4S combines scheduled availability checks with server-agent telemetry and operational state so operators can view infrastructure from one control plane.
Servers
- CPU utilization and load visibility.
- Memory utilization.
- Disk usage and storage state.
- Network activity.
- Service discovery and service state.
- Agent pairing and telemetry when available.
Websites
- HTTP/HTTPS availability monitoring.
- Response failure detection.
- SSL/certificate visibility.
- Workspace and customer asset organization.
Services
Service monitors can represent common Linux infrastructure services or custom service definitions.
Apache
Nginx
MySQL / MariaDB
PostgreSQL
Redis
SMTP
IMAP
POP3
FTP
SSH
Custom
Agents
The E4S agent provides deeper host telemetry and enables agent-aware operations. Agent communication is handled through the Agent API path behind the E4S reverse proxy.
Check Agent API
e4s agent-healthAlerts and Live Center
Live Center is intended to provide immediate operational visibility. Alerts can surface incidents and important infrastructure state through the notification channels enabled for the installation.